Operations Report
Last Modified on 04/23/2026 12:19 pm PDT
Pathway: Reports > Standard Reports > AR > Operations Report
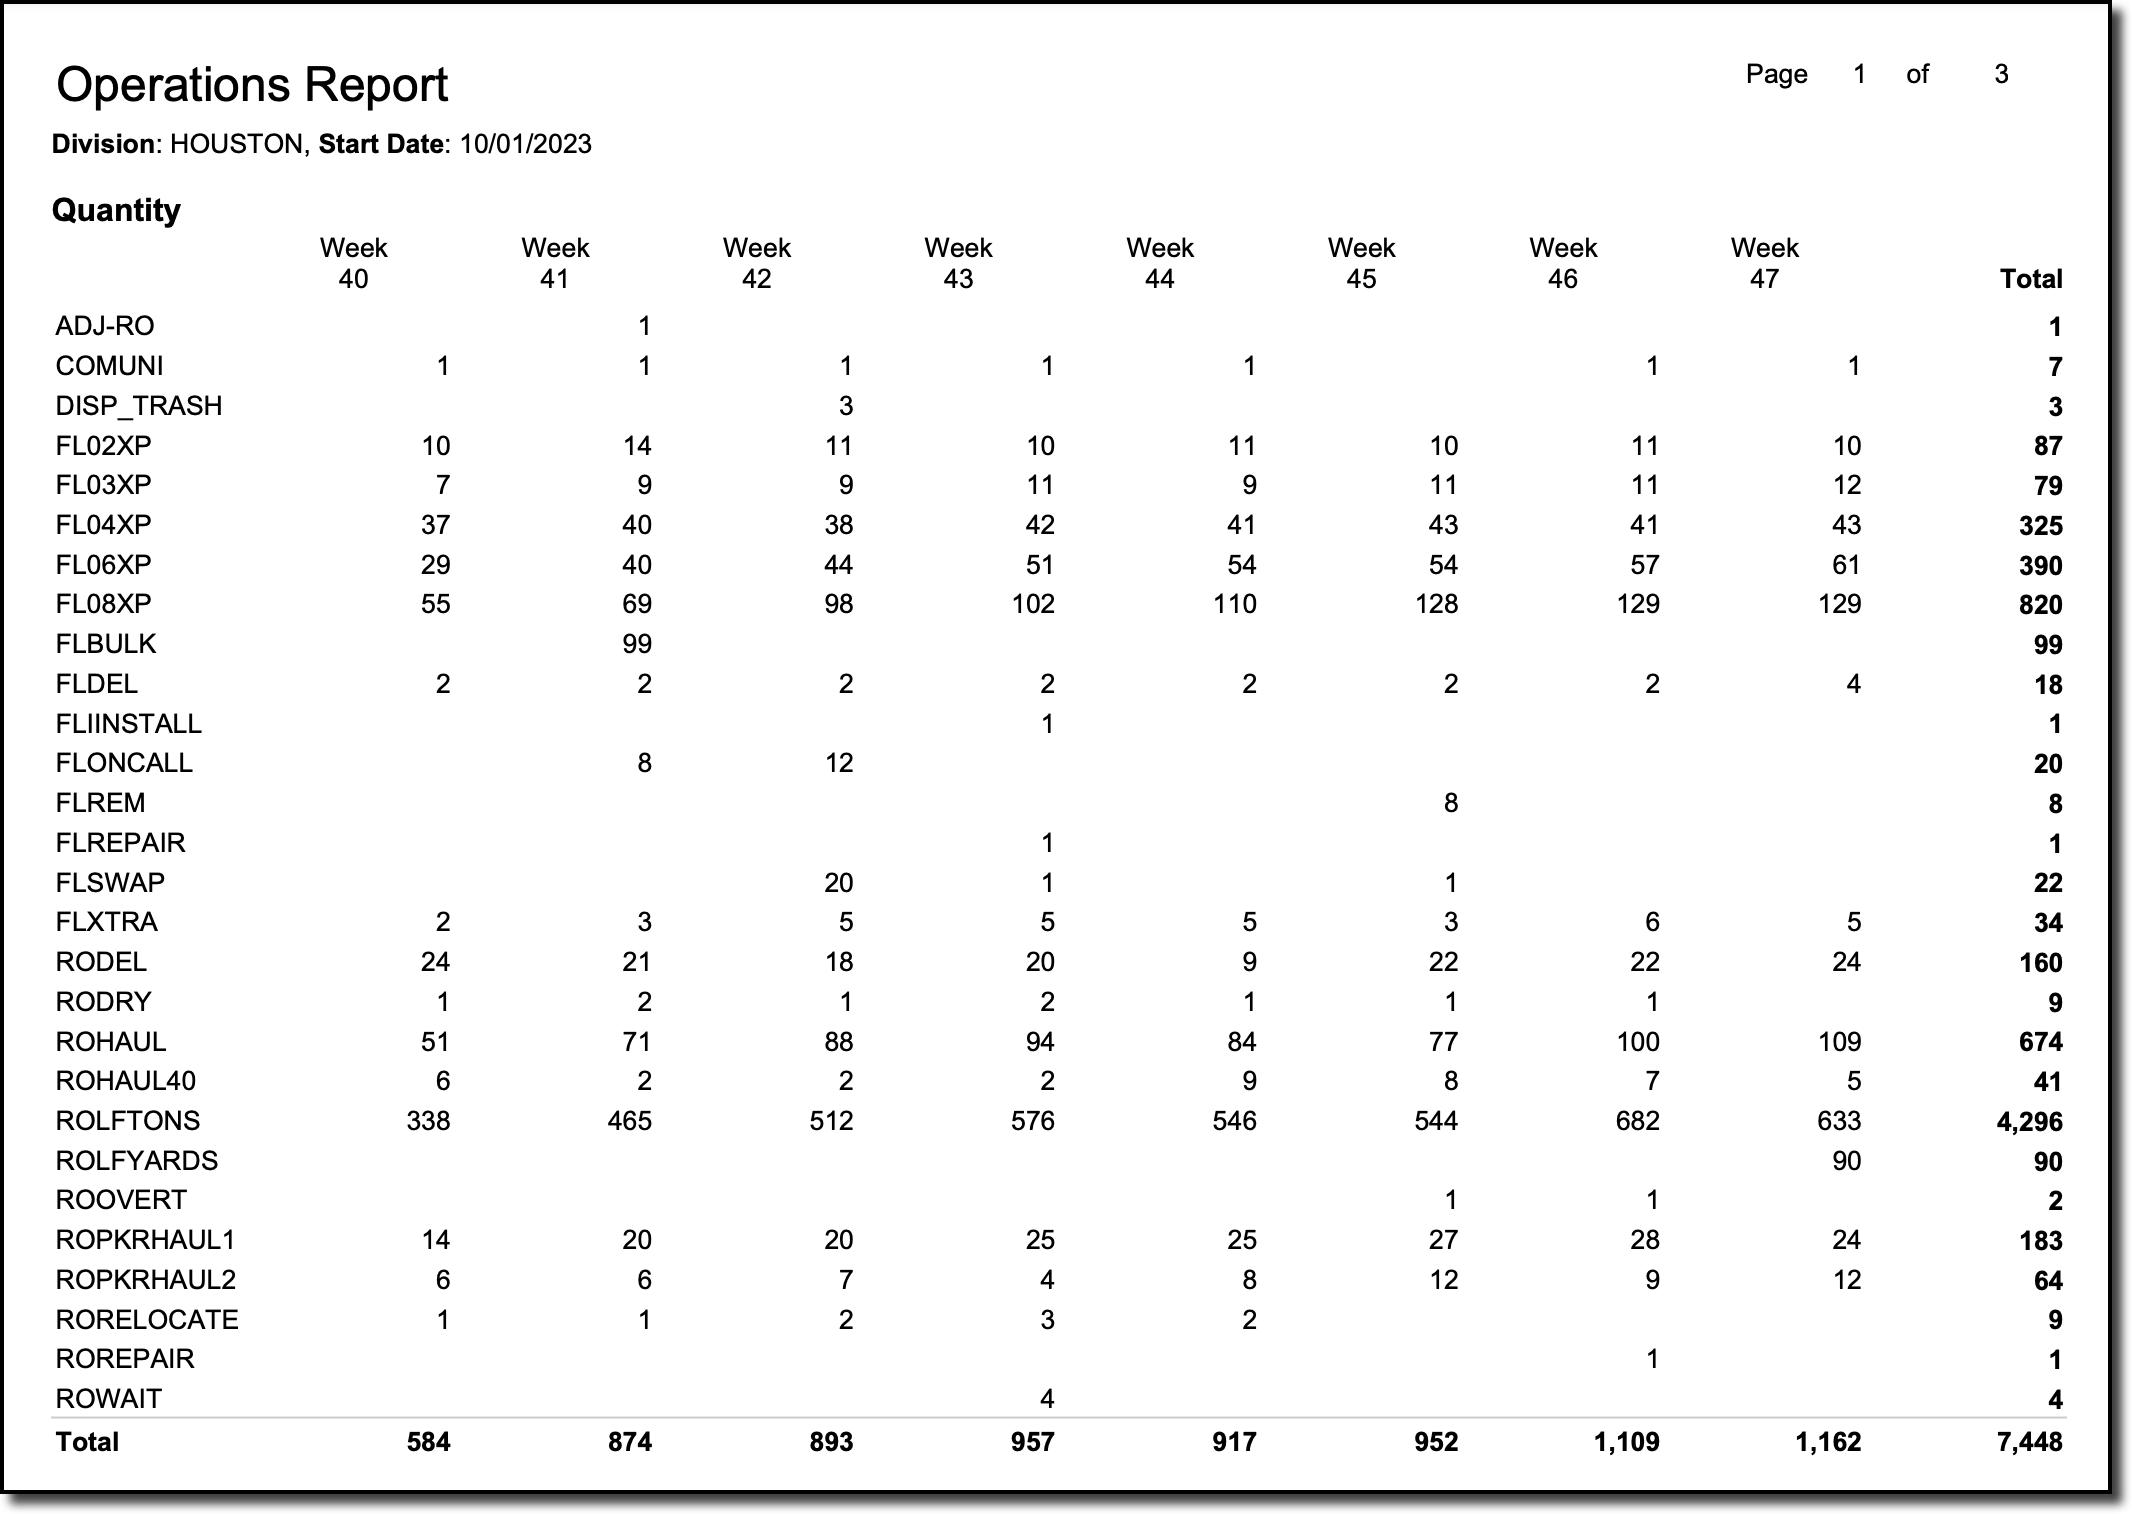
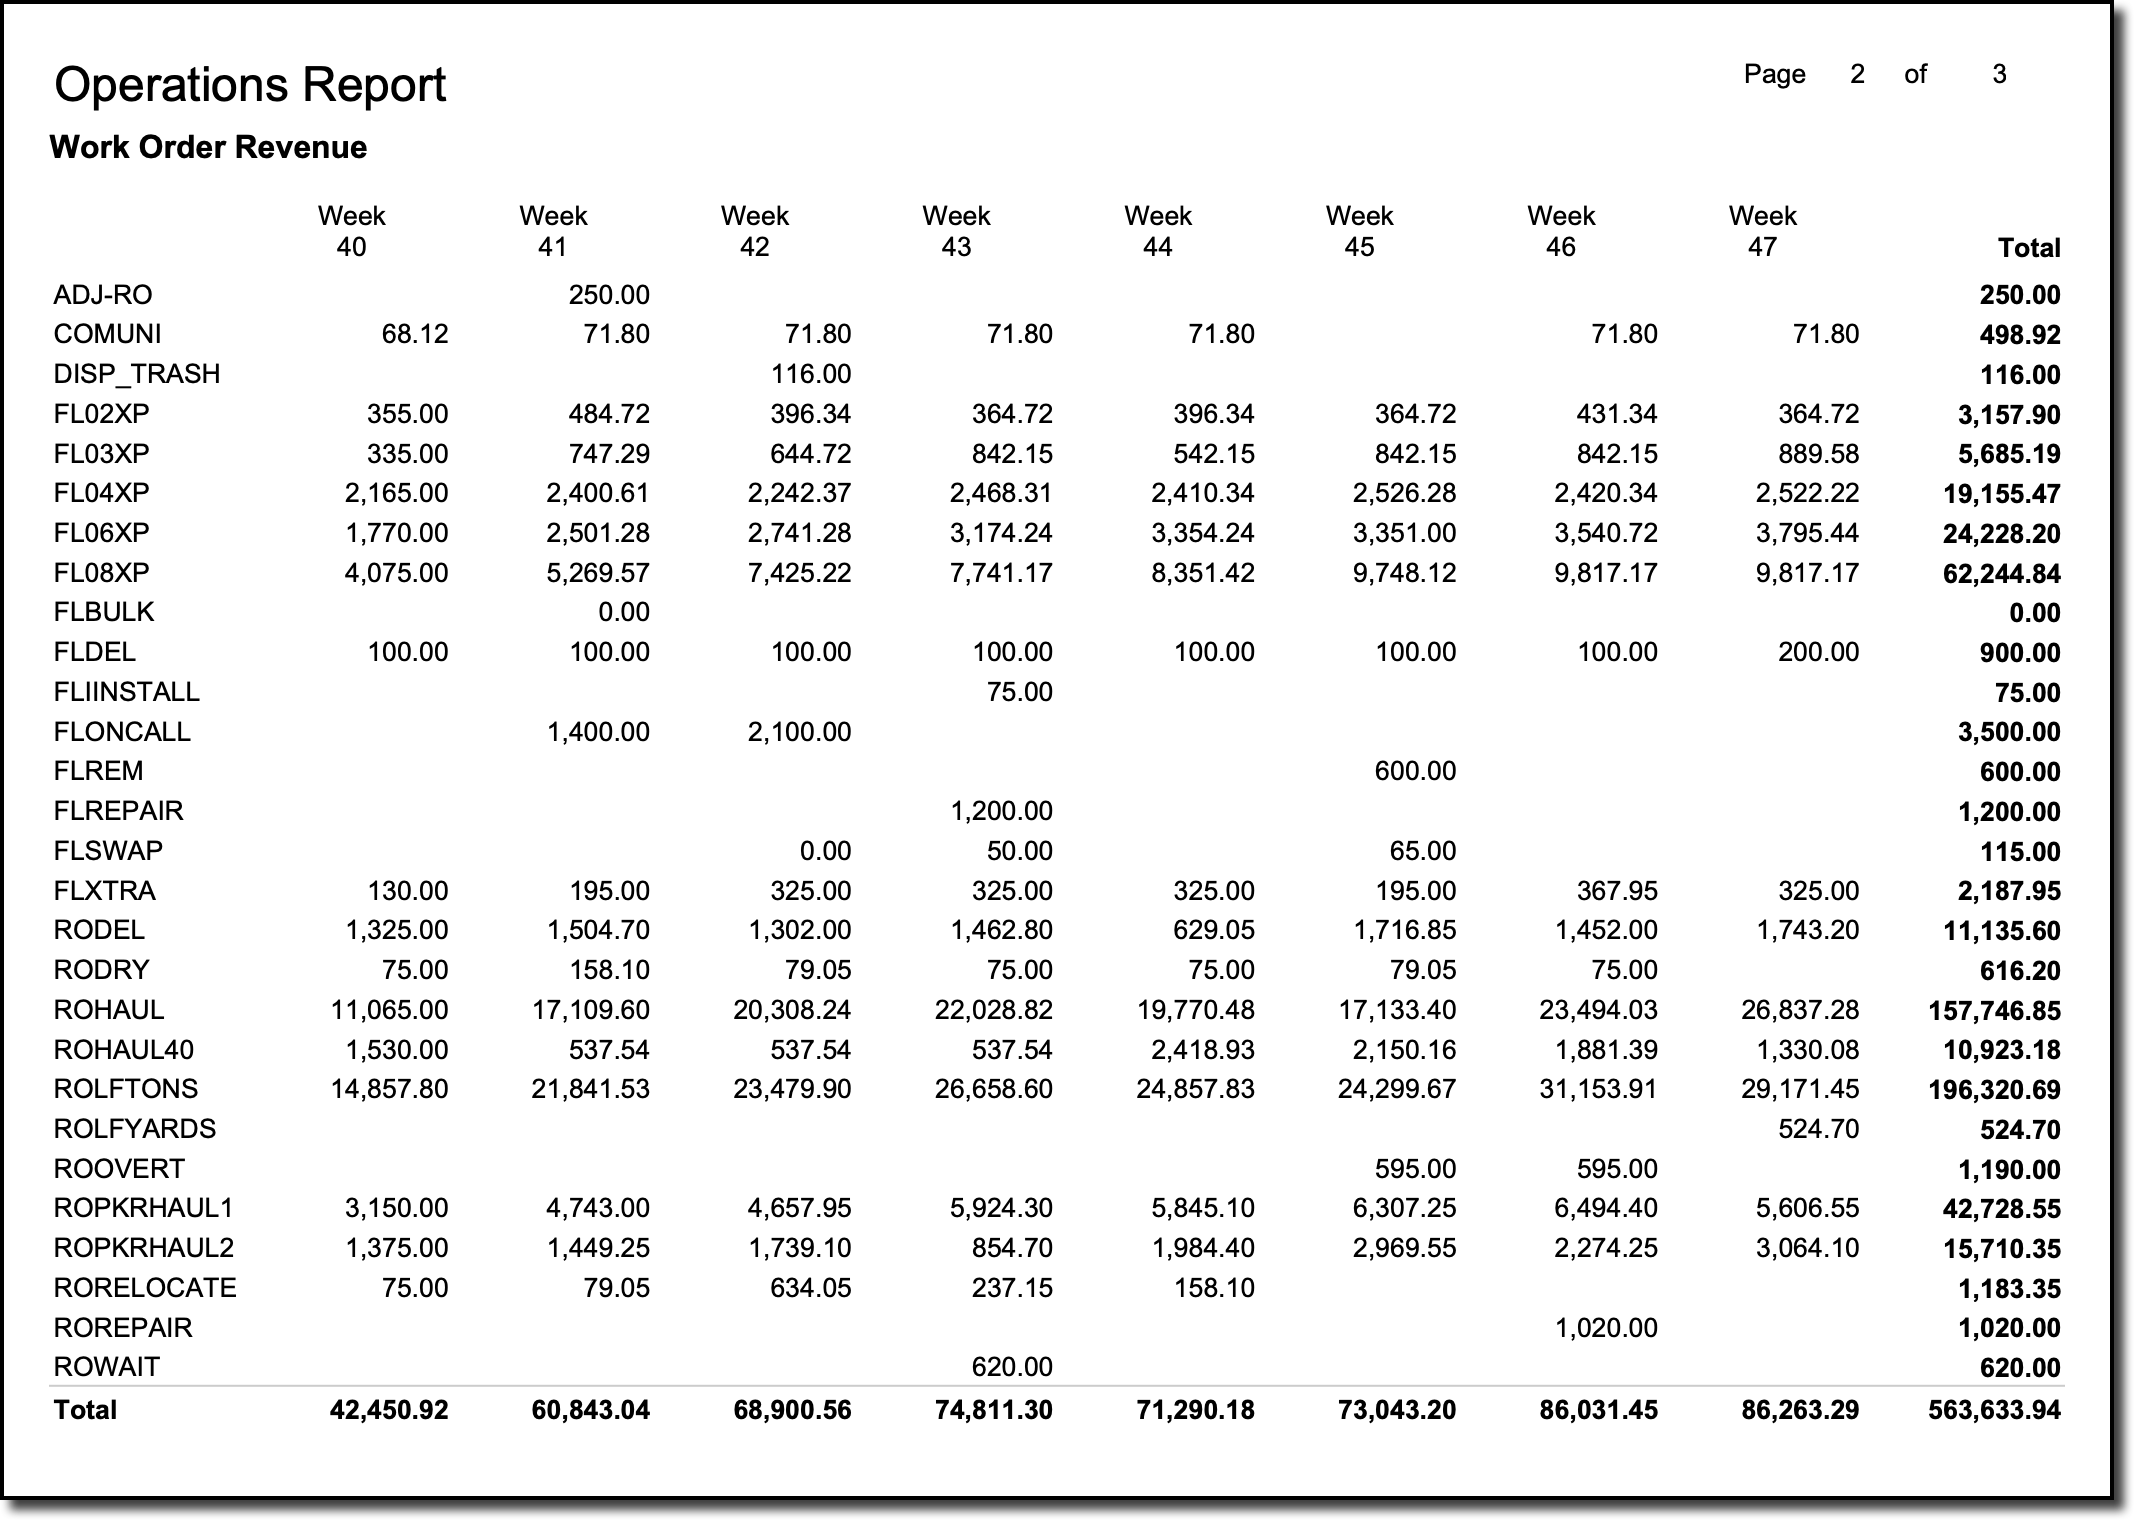
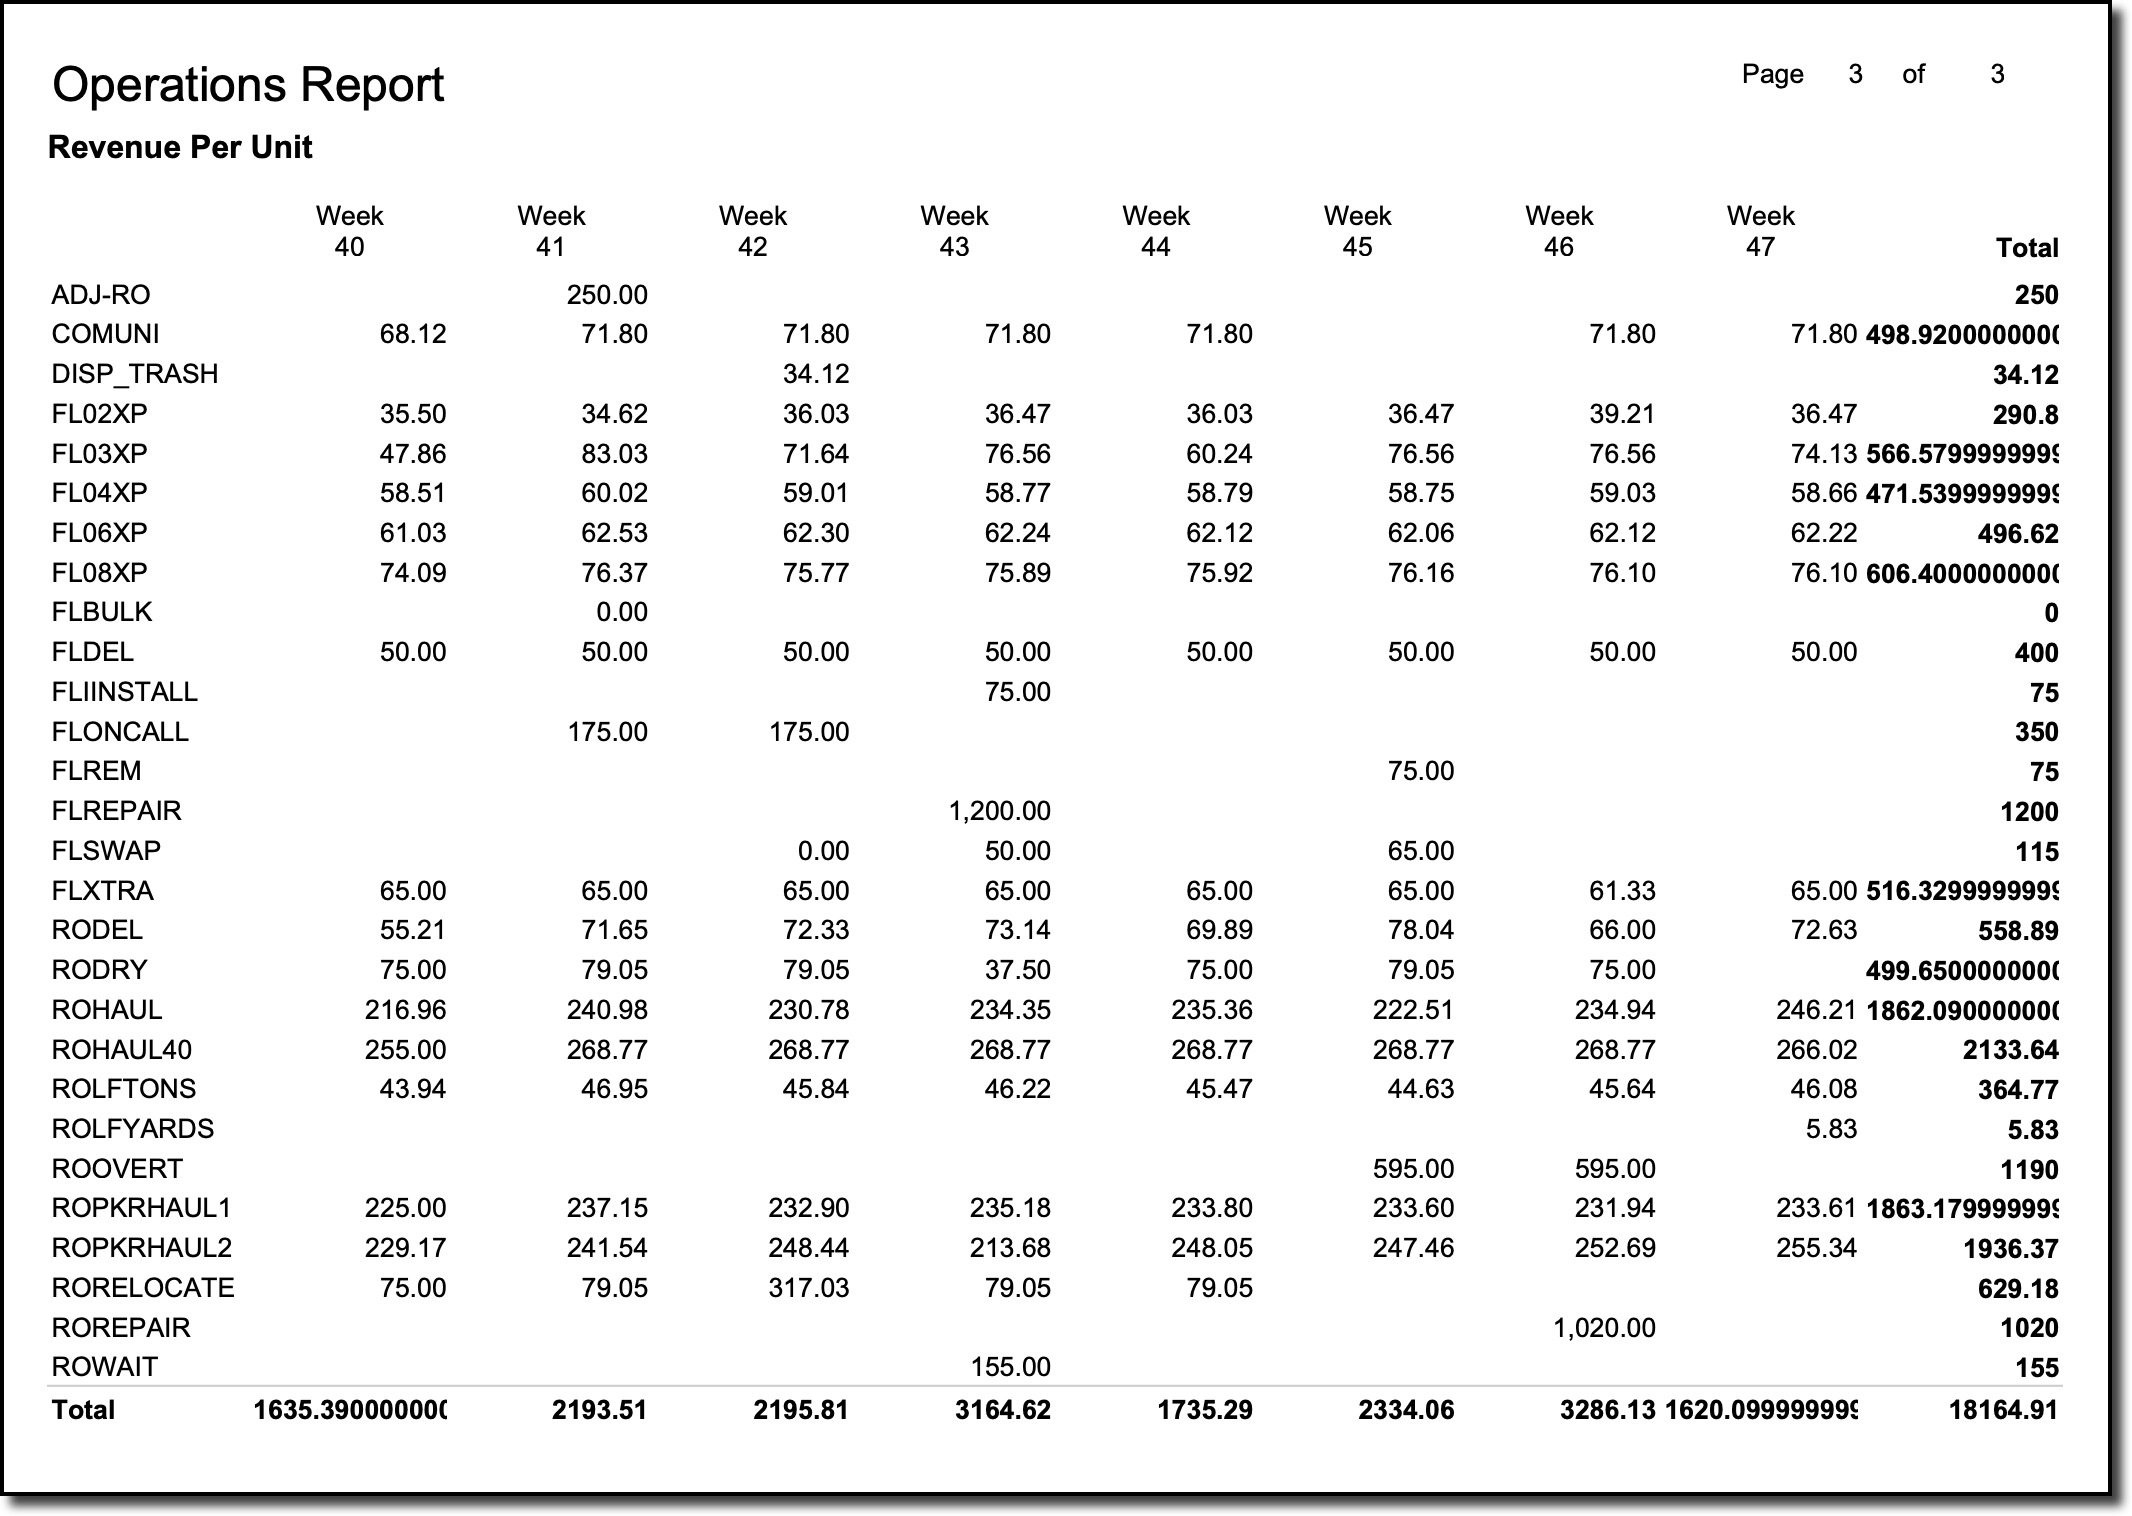
The Operations Report offers a weekly breakdown of service codes and their corresponding revenue amounts. Upon generation, the report is divided into three sections to analyze the operations:
- Quantity - the number of services that occurred with totals
- Work Order Revenue - revenue collected on each service code with totals
- Revenue Per Unit - per unit rate for each of the service codes with totals
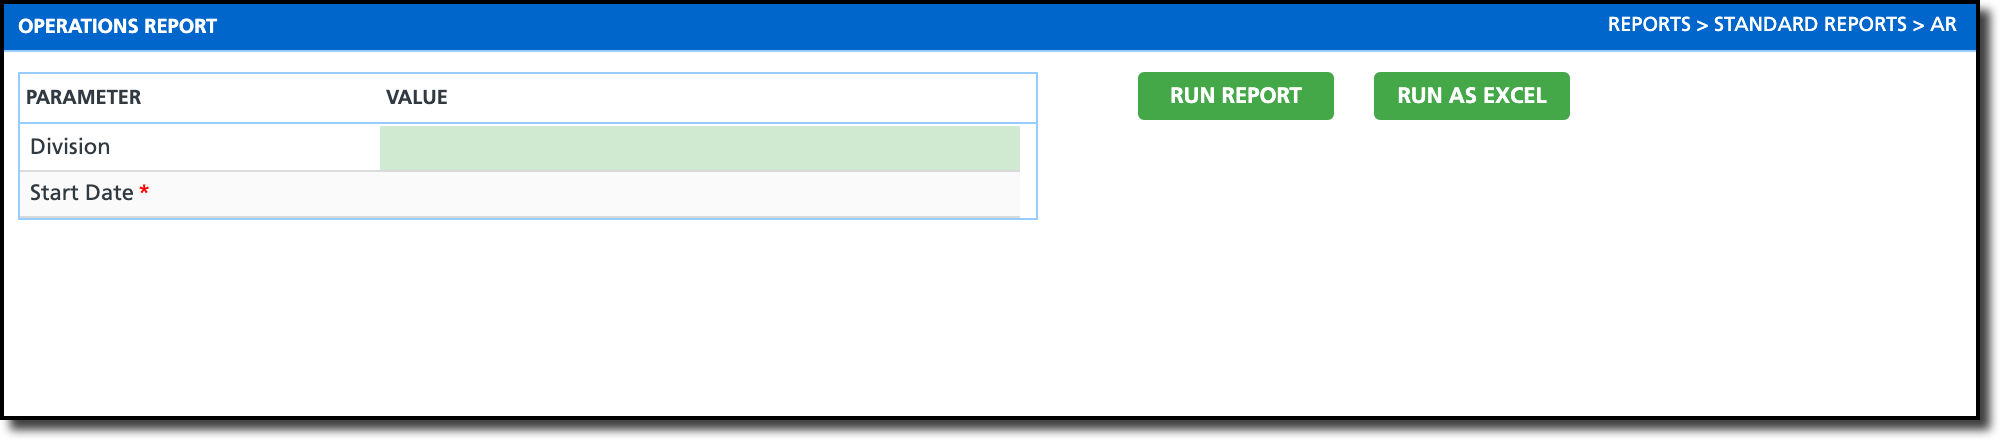
Report Parameters
Parameters are the specific criteria required to run a report, ensuring the system pulls only the specific data you need for your analysis.
| Parameter |
Value |
Division
Required |
Filters the report to only return results for accounts in the selected Division.
|
Start Date
Required
|
Filters the report to return results on or after the Start Date to the current date.
|
Run the Report
Follow these simple steps to run the report.
- Select the Division to pull data just for that division.
- Select the Start Date to limit results to include that date to the current date.
- Select Run Report or Run as Excel.
- Run Report: results of the generated report will display in the Report Results tab.
- Run as Excel: results will be exported to Excel for the user to open and view.
- Create a Saved Template for faster use later.
- After all parameters are set, click on the Save As button at the top of the screen.
- Enter a Name for the template and click Save.
- The option to make the template available to other users is provided by checking the Public Access check box. Otherwise, if left unchecked, the report is only available to the user account it was created under.
Understand The Report
Below is a sample report followed by a detailed breakdown of the data in the report.
Header / Footer
The header of the report displays the selected parameter values. Page numbers are also located at the top of every page. For audit purposes, the bottom of each page includes the name of the user who generated the report and a precise generation timestamp.
Report Body
The Operations Report is organized into three distinct sections upon generation: Quantity, Work Order Revenue, and Revenue Per Unit. In each section, Service Codes are displayed in alphabetical order on the left, while the week of the year (calculated based on the entered Start Date) is displayed in the Header row.
Quantity
The Quantity section of the Operations Report provides a break down of each service code and displays a weekly total and cumulative total of its use.
Work Order Revenue
The Work Order Revenue section of the Operations Report details the weekly revenue amount collected on each service code and the cumulative total of all weeks displayed.
Revenue Per Unit
The Revenue Per Unit section of the Operations Report displays the per unit rate for each of the service codes and a cumulative total spanning across all the weeks.
Permissions
| Permission ID |
Permission Name |
154
|
Standard AR / Report |
155
|
Standard Account / Report |


