Pipeline Summary
Last Modified on 04/05/2023 2:17 pm PDT
Pathway: Sales > Pipelines > Pipeline Summary
The Sales Pipeline Summary screen displays a snapshot of data reported in the Sales Pipeline (Opportunities and Leads) dashboards. Use the filter options provided to review the data or, select the pipeline's value to open the sales pipeline tool it is pulled from.
Screen Descriptions
| Field | Descriptions |
| Filters |
Division
| Filters to only include locations that are assigned to the selected division(s).
|
Sales Rep
| Filters to only include locations that are assigned to the selected Sales Rep(s).
|
Account Class
| Filters to only include locations that are assigned to the selected account class(es).
|
Type
| Filters to only include locations that are of Permanent or Temporary service types.
|
Prospects Only
| Option to only display the sites of prospect accounts. Hides active accounts that have a proposal, lead or contract for existing and new business needs.
|
Dashboards
|
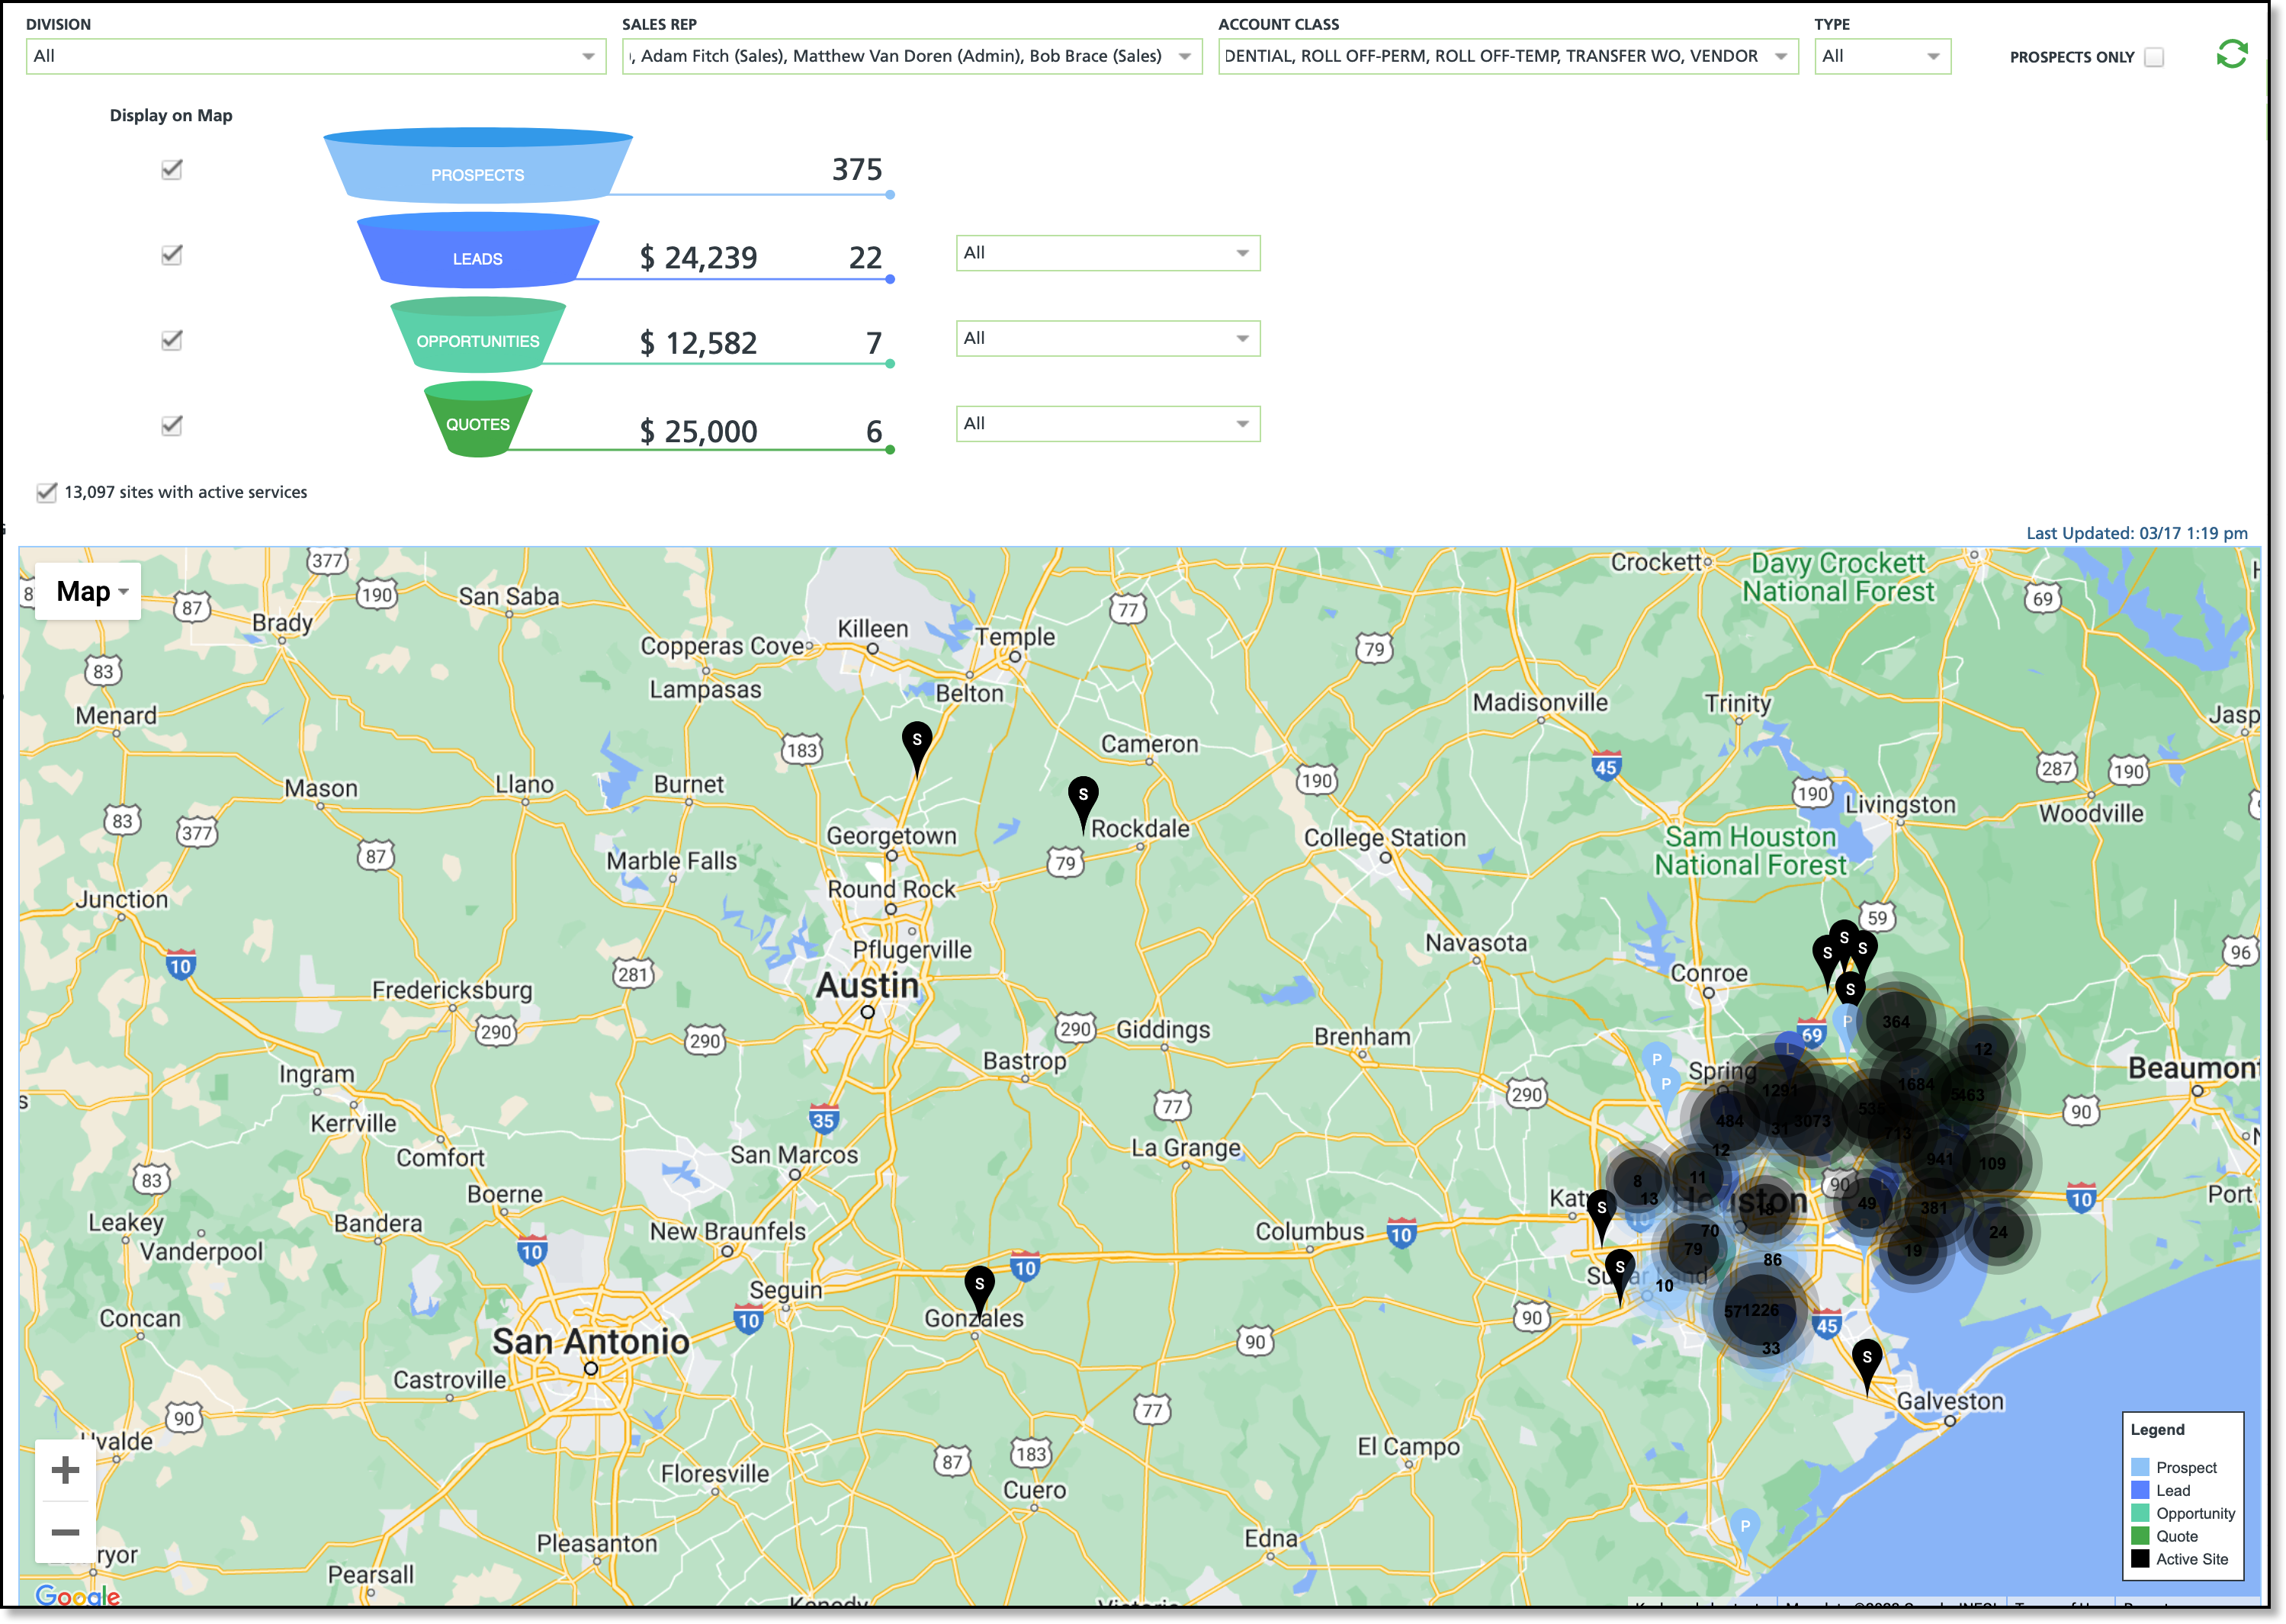
Display on Map
| Select to include the dashboard on the map.
|
Prospects
| Displays the total count of prospect accounts.
|
Leads
| Displays the total count of qualified leads from the Sales Pipeline - Leads dashboard. Leads include accounts (prospect or active) that competitor information has been collected on for a service. Select the value to open the dashboard.
|
Opportunities
| Displays the total count of opportunities from the Sales Pipeline - Opportunities dashboard. Opportunities include accounts (prospect or active) that received a proposal for services at an existing or new site. Select the value to open the Opportunities dashboard.
|
Quotes
| Displays the total count of quotes from the Sales Pipeline Opportunities dashboard. Quotes include accounts (prospect or active) that have received a Contract or Service Agreement for services at an existing or new site. Select the value to open the Opportunities dashboard.
|
| Map Features |
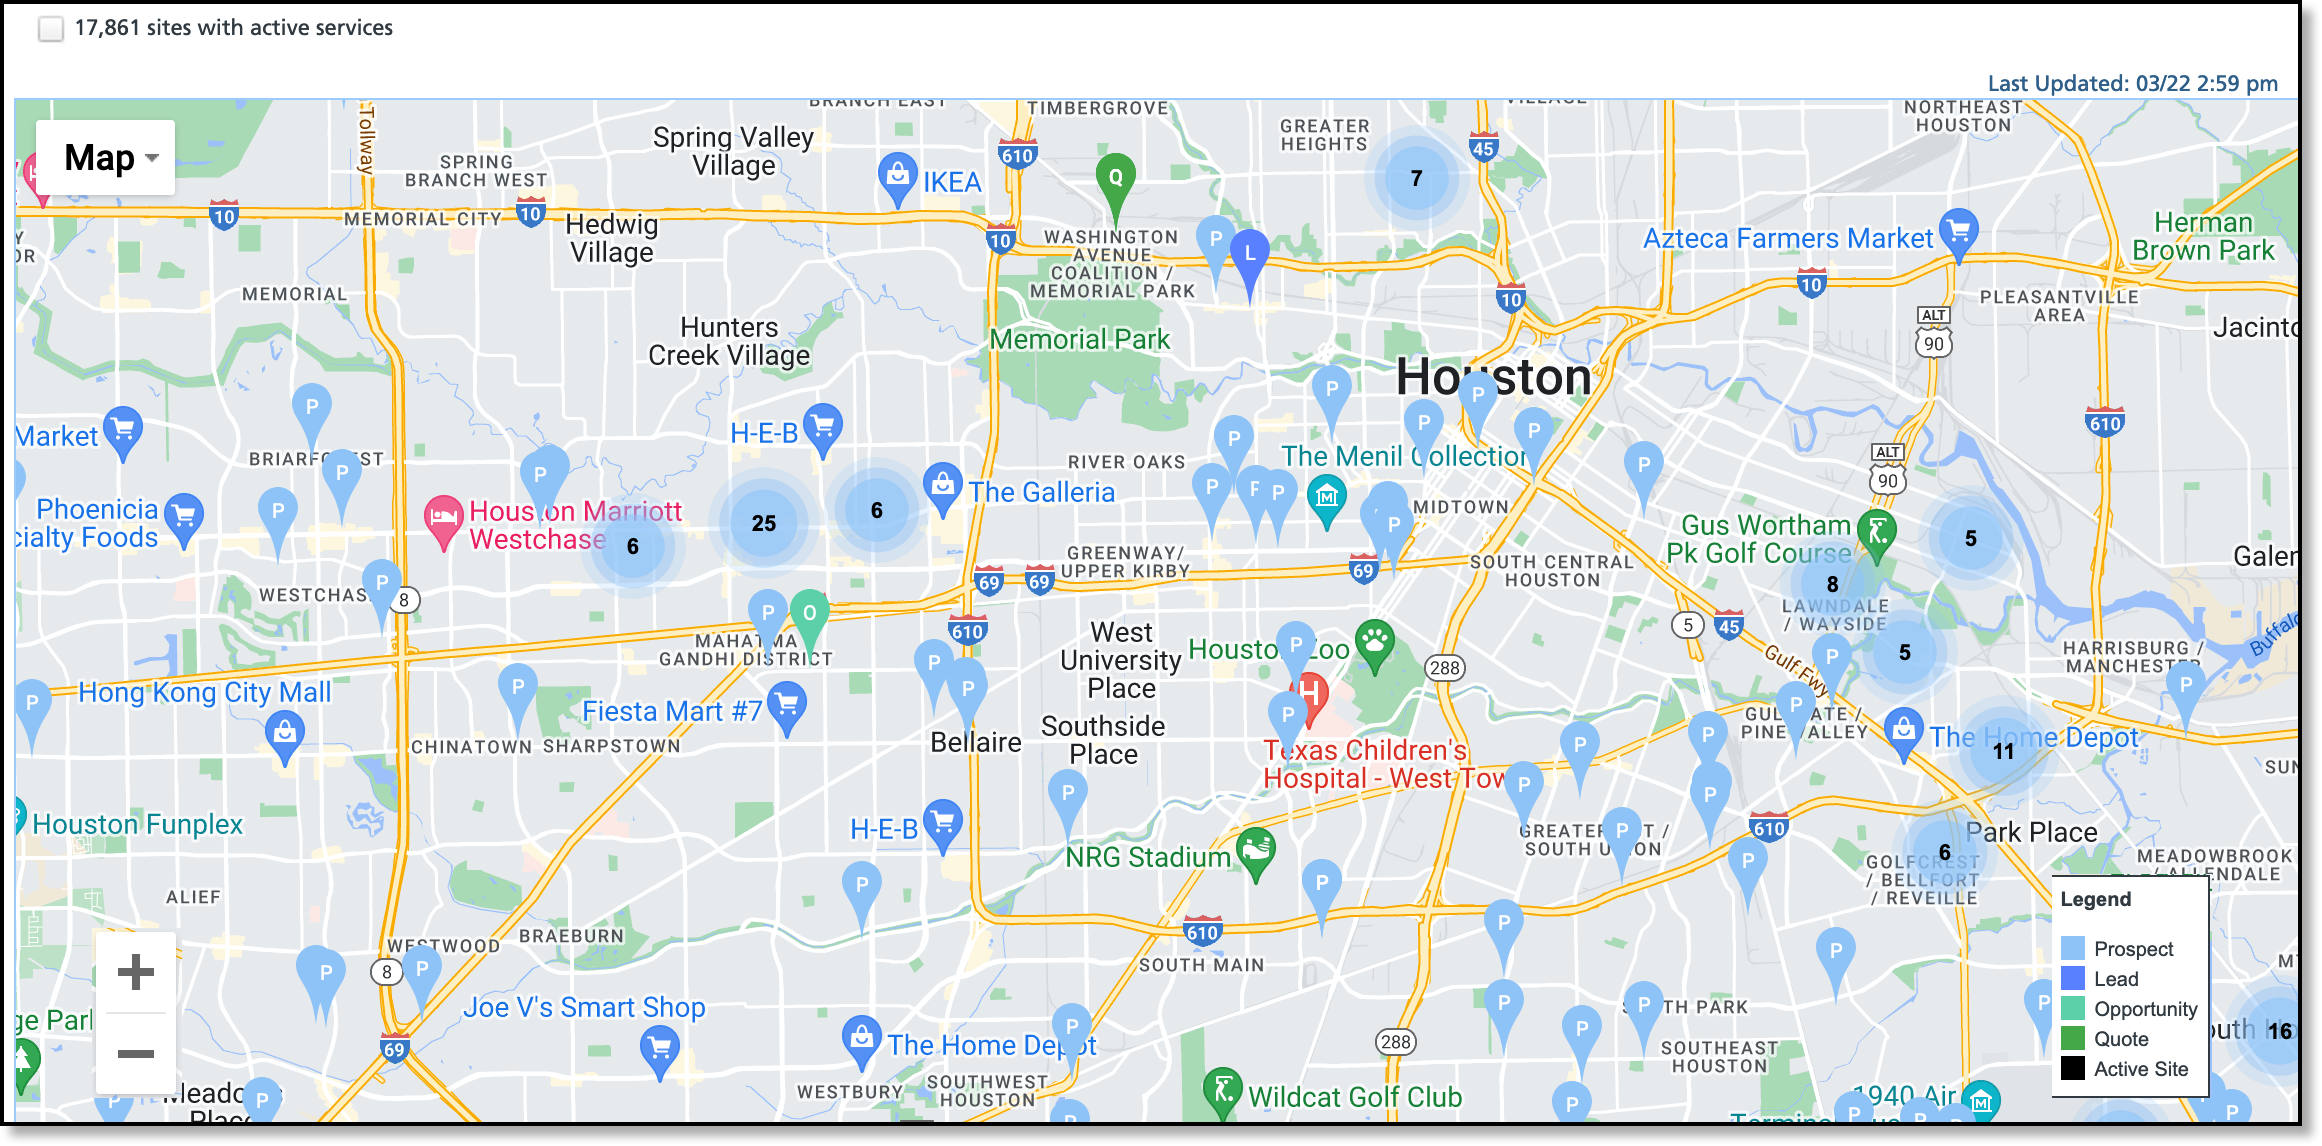
Pins
| Pins are used to mark each location the dashboards include. Pin clusters are used in areas that have a large amount of locations to map. Zoom in on the area to reduce the grouping and view pins for each location. |
Zoom
| Use the + and - options on the left side of the map to zoom in and out. Otherwise, the dial on your computer mouse can be used. |
View Location
| Click on a pin to view the information for the location. Select the account number to open the account.
|
Pipeline Summary - Upper Grid
Sales data for Pipeline Summary is pulled from the Sales Pipeline Leads and Sales Pipeline Opportunities dashboards. A hyperlink to each dashboard is provided by selecting the values associated to the pipeline. Information displayed here can be used to drill down on the various sales areas and help forecast sales goals.

Map - Lower Grid
The Sales Pipeline Summary map displays the locations that were included in the dashboard counts. This map uses pins and pin clusters to identify the location of the prospective site. A 'pin cluster' is used to mark areas containing a higher volume of locations.